How I’m using Machine Learning to Trade in the Stock Market

Disclaimer: This article is about a simple strategy that I have used to create a trading bot. While back-testing shows that the trading bot is profitable, the trading bot is not capable of handling “black swan” events such as market crashes. Also I am not a financial advisor nor a professional trader. I am simply sharing this for entertainment purposes. So trade & read at your own risk.
Back in my senior year of college I was first introduced to the stock market by a friend. I remember buying a stock that was recommended by a youtuber (not the smartest thing) and making a 100% return in a matter of hours. This trade was so memorable that I still remember the stock. The ticker symbol was AETI. Clearly it was beginners luck, because I had no idea what I was doing. Since then I have invested a lot of time and money into financial markets and had a fair share of gains and losses. Although, I have been moderately successful, I recently discovered that I could have been more successful if not for my emotions.
Since this discovery, I have been looking for ways to mitigate my emotions during investing and trading. I realized the best way to get rid of emotions is by creating a trading bot. After researching several algorithmic trading strategies, I decided to come up with my own model by utilizing a basic machine learning model, Logistic Regression (LR).
Creating the strategy..
The most fundamental strategy in the stock market is buying low and selling high. Now, if you have invested or traded for a long time, you’d know that it’s not as easy as it sounds. So, I wanted to create a model that predicts low’s and high’s of stocks as accurately as possible.
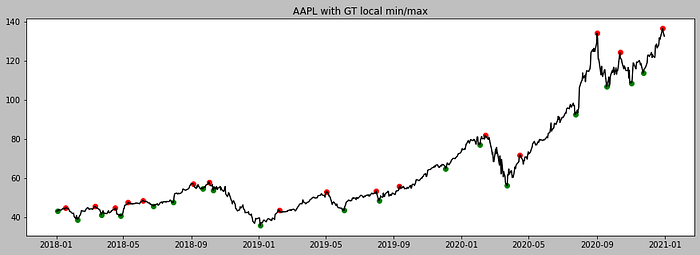
In Figure 1, you see Apple’s daily stock price action from year 2018 to 2021. The green dots are local minimum values and red dots are local maximum values. So my intention was to use ML and predict if a data point is a green dot (category 0) or a red dot (category 1). The goal is to simply buy if the model predicts a green point and sell when the stock price goes up a certain percentage.
Here are the four steps of my strategy
- Use the ML model to predict if buying the stock is favorable on a certain day.
- If favorable(green dots) buy the stock.
- Once the stock rises a certain percentage sell the stock for a gain.
- If the stock dips a certain percentage sell the stock for a loss.
Some other details
- The algorithm will only hold one stock at a time (This was done to keep everything simple)
- The selling percentages are two hyperparameters of the model that we can choose to maximize gains.
- In case you are wondering, “what if the data point is neither a local max nor a local min?”, hang on we’ll talk about this later on.
The ML model
As mentioned above, the machine learning model I used was Logistic Regression (LR). If you are not familiar with LR, you can check my tutorial notebook by clicking here.
First, our problem is a binary classification problem with two targeted outputs. Namely, local minimums (category 0, ‘green dots’) and local maximums (category 1, ‘red dots’). Next we have to determine the inputs of the model. A very simple idea is to use the stock price & the volume as inputs to the LR model and predict if it is a local minimum or a local maximum. However, the stock price and volume are very little information to predict something as complicated as the direction of a stock. Therefore, I additionally involved four other input parameters in my model.
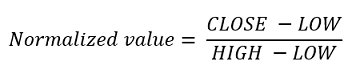
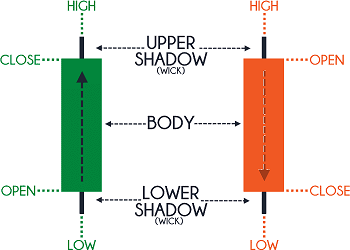
- Normalized stock price — Instead of using the stock price, I used a normalized stock price as my first input parameter. A stock’s price action can usually be depicted by a candlestick as in Figure 2. The candlestick represents the highest stock price (HIGH), the lowest stock price (LOW), the open stock price (OPEN) and the close price (CLOSE) for the day (if we consider a daily chart as in Figure 1). In order to make it easier I created a single value between 0 and 1 representing all four of these values. This value was calculated by the Equation 1. If the resulting value is close to 1, this means that the stock has closed near the HIGH of the day, whereas if the normalized value is near 0 it means that the stock has closed near the LOW of the day. The advantage of using such a value is that it contains information of the price action of the whole day compared to using a single value such as the CLOSE or the average of the day. Also this value is not sensitive to stock splits.
- Volume — The second parameter used in the model was the daily volume of the stock. This parameter represents the amount of shares traded (both bought and sold) on a specific day.
- 3 day regression coefficient — The next parameter was the 3 day regression coefficient. This was calculated by performing linear regression to the past three day closing prices. This represents the direction of the stock in the past three days.
- 5 day regression coefficient — A similar parameter to the 3 day regression coefficient. Instead of three days here I used five days.
- 10 day regression coefficient — Same as above, but used 10 day regression. This value represents the direction of the stock price in the past ten days.
- 20 day regression coefficient — Same as above, but used a 20 day regression.
Training and validating the model
After defining my model, I used the TD Ameritrade API to collect the historical data to train the model. The stocks used to create the dataset were the thirty companies of the DOW 30 and twenty other prominent companies of the S&P 500. The training and validation data spanned between 2007 to 2020 (including). The testing data was from 2021.
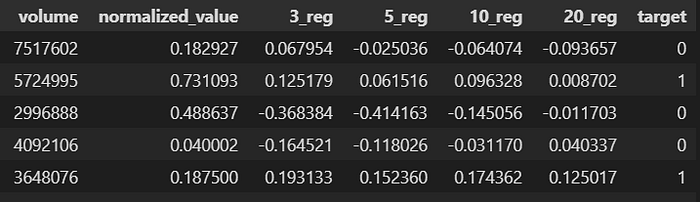
In order to prepare the training and validation data, I first found data points representing either a buying point (category 0 or green dots in Figure 1) or a selling point (category 1). This was done by an algorithm created to search for local mins and max points. After selecting the data points, the volume data was collected and the normalized price value & regression parameters were calculated. Figure 3 shows a sample of input data.
After preparing data, I used the scikit-learn package to split the data into train & validation sets and train the LR model. The LR model used the input parameters and predicted the target value.
Validation results and analysis
The validation set contained 507 data samples. The fully trained LR model was able to predict the validation data with a 88.5% accuracy.
This accuracy of the model at first seems to be very convincing. So let’s see how the model performs on a stock in year 2021. To do this I chose data from Goldman Sachs (stock ticker GS) and predicted the direction of the stock on each day using the trained LR model. The results are depicted in Figure 4.
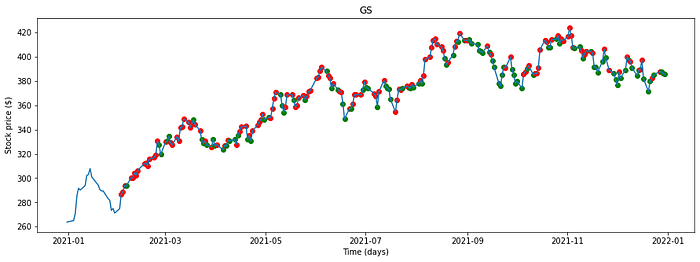
When you look at Figure 4, you see that the model is predicting a lot of false positives (positives being buying points). Although it seems to predict almost all the local minimums correctly, it falsely predict buying points. If you remember from the training phase, I only used local maximums and local minimums to train the model. So the model predictions on the intermediate data points are very weak.
This can be a costly mistake in investing. After all, buying high and selling low is not our intention 😬. So, how can we resolve this and choose the buying points with more certainty. Let’s go back to the validation results and see if we can find a way to increase the certainty of our buying points.
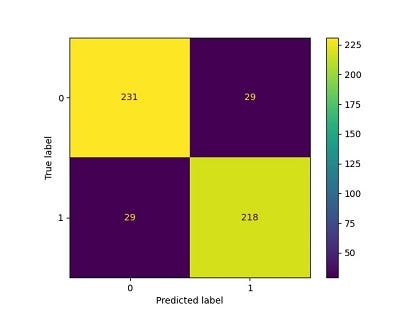
In Figure 5, you can see the confusion matrix of the validation results. There are 29 instances that our model predicted in category 0 (buying point/local minimum) when it was actually a category 1 (selling point/local maximum). These are false positive values (falsely identify negatives as positives. Also remember that in our case positives are buying points). If we recall the strategy, the goal of my model was to find buying points using the ML model. So we can try to reduce these false positives and make sure the model predicts buying points with high certainty. We can do this by changing the threshold of our LR model.
In Logistic Regression binary classification, the default threshold is 0.5. Meaning that if the modal predicts a probability greater than 0.5, that data sample will fall into category 1 whereas if the model predicts a probability less than 0.5 the data point will fall in to category 0. We can change this threshold to increase the confidence of the model predictions of a certain category. For example if we change this threshold to 0.1 only the predictions less than 0.1 will be selected as buying points (category 0). This decreases the number of false buying points as the model only selects the samples that are near 0.
So in order to make sure my model predicts buying points with more certainty. I changed the threshold of my model to 0.03. (Note that this is just an example. We can later try to change the threshold to tune the model to perform well). You can now see the new confusion matrix in Figure 6.
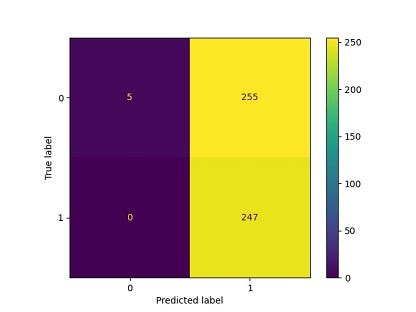
As you can see now the number of false positives are zero. However, the downside of this is that the model misses a lot of true positive values. In our case the model only recognizes five buying points and misses to identify a lot of other buying points.
Now let’s use the new threshold and re-plot the buying points for the Goldman Sachs stock in 2021.
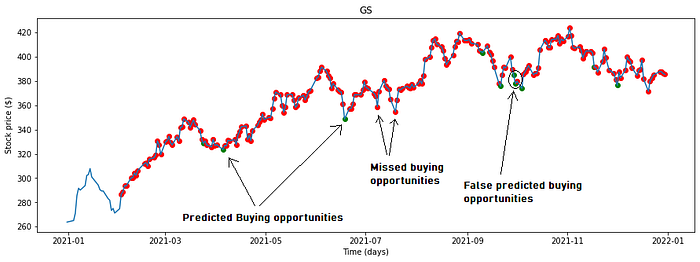
As you can see in Figure 7, now the model predicts buying opportunities with more certainty. However, it also has missed several buying opportunities. This is the sacrifice we have to make in order to buy with high certainty.
Back-testing & results
Next, I back-tested my strategy on 2021 stock market data. I created a stock simulator and a back-testing script that scans for buying opportunities in the DOW 30 everyday using the LR model and a given threshold(t). If there is a stock available, the simulator then buys the stock and holds the stock until it reaches a certain percentage gain(g), a certain percentage loss(l) or a sells after a certain amount of days(d). The final back-testing simulations had four parameters (t, g, l, d) and the goal was to maximize profit.
I also created four investor types by changing these parameters. The “Impatient Trader”, “Moderate Holder”, “Patient Swing Trader” and “The APE”.
- The Impatient Trader — This type of trader buys and holds the stock for a very short period of time. The trader also looks for small gains. This trader is also scared of losses, so the trader tends to sell the stock for a loss if the stock drops even a little bit. Finally this trader chooses stocks with a high threshold in order to quickly find another stock once they get rid of their current stock. So, parameters for this type of trader are t = 0.3, g = 0.005, l = 0.001 and d = 3.
- The Moderate Holder — This type of trader buys and holds the stock for a moderate period of time. The trader is looking for stocks with high confidence so the threshold value tends to be low. The trader also looks for higher gains and has a higher tolerance for losses compared to the Impatient Trader. For this type of trader the parameters are t = 0.1, g = 0.03, l = 0.03 and d = 10.
- The Patient Swing Trader — As the word “swing” suggests, this type of trader tends to hold the stock longer. Also the trader likes to select stocks with high probability of success. So the threshold is very low for this type of trader. Also this trader believes in selling stocks for smaller losses and moving on to different stocks. The parameters for this type of trader are t = 0.05, g = 0.04, l = 0.003 and d = 21.
- The APE — The APE is the type of traders that are new to the stock market. They tend to choose stocks irrationally. So the do not use any strategy to select stocks. These types of investors randomly pick stocks and randomly sell them whenever they feel like it.
Now let’s run back-testing and see how the four investors perform. These simulations are based on 2021 data and each investor is given a 3000 USD as their starting balance. The performance of each investor type is gauged at the end of 2021.
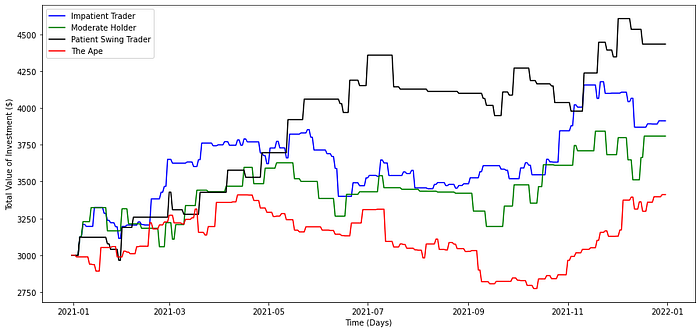
Figure 8, shows the results of how the four investors have performed. The “Patient Swing Trader” has been able to make the largest profit by making a 47.77% gain at the end of year 2021 followed by the impatient trader with a gain of 30.41%. As expected, the irrational trader “The APE” has the lowest returns with a 13.72% gain.
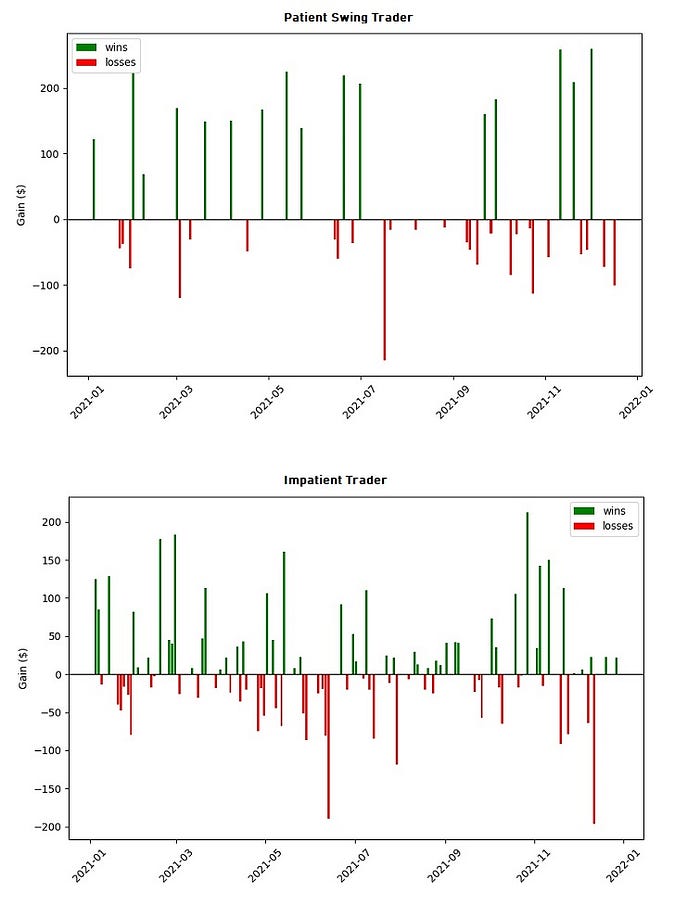
Figure 9 shows the win/loss bar plots for the “Patient Swing Trader” and the “Impatient Trader”. As expected, the patient swing trader has taken a small amount of trades and has cut losses as quickly as possible. The impatient trader has taken a higher amount of trades and has frequently suffered losses. This can also be seen in Table 1.

These results suggest that when using the LR model, it is beneficial to buy stocks with high confidence and hold them for a longer period than frequently buying stocks with less confidence. However, we should also note that in 2021 the stock markets saw some big gains, and these results potentially could be an outcome of that. Clearly even the irrational investor, “The APE”, makes a 13.72% return which shows that the markets have been generous in the year 2021.
Comparison with S&P 500
Next, I compared the performance of my top two investor models with the S&P performance in 2021.
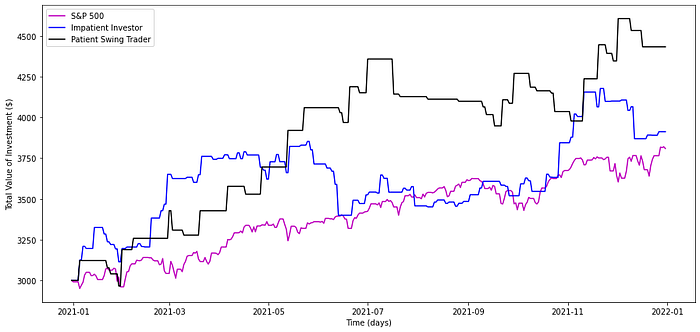
Figure 10 shows the performance if 3000 USD was invested to the S&P 500 in January. The results show that the investment has grown by 26.9%. This is low compared to the 47.77% return by the “Patient Swing Trader” and the 30.41% return by the “Impatient Trader”. Furthermore, “The Patient Swing Trader” outperforms the 35% return of Apple (ticker symbol AAPL) and go head to head with the 49% return of Microsoft (ticker symbol MSFT) in 2021.
Other thoughts and future work
In our current back-testing simulations we are only testing the performance of our strategy when the algorithm is trading one favorable stock at a time. The algorithm scans over all the stocks in the DOW-30 and suggest the best stock out of the lot. However, in a real world situation we can change the amount of stocks we are holding in to multiple favorable stocks. This could change the performance of our back-testing simulations and potentially change the return to a much higher value.
Another possible way to optimize the performance of our model is by training the LR model to predict buying points, selling points and neutral points (points in between local maximums and minimums). This way we can predict buying points with more certainty and reduce the missed buying opportunities as in our current version. This is because this type of model is able to predict neutral points and now those neutral points will less likely to be identified as buying points.
Additionally, we can introduce more input variables such as 30 day regression coefficients, market capitals, price to earning ratios to increase the predictability of the model. We can also utilize lasso regularization to zero out input variables that are not significant for prediction and weigh more on the important ones. Furthermore we can also test other ML models such as Support Vector Machines & Random Forests to see how the performance changes. Finally, we can also use Deep Learning techniques such as LSTM’s that have been previously used in financial forecasting.
Conclusion
In this blog post, I have described how I am using a simple ML model, Logistic Regression, to trade in the stock market. Back-testing results of the strategy look promising with maximum of 47.77% return beating the S&P 500 in 2021. Although, back-testing results show that the model is profitable, it has to be tested in real time to actually verify the profitability of the strategy. Currently, I am running a hybrid trading bot (Since the model runs in real time with real money I made sure that I can intervein the bot anytime and close orders easily. Hence the word “hybrid”) using the strategy in my Interactive Brokers Account. Although, the model seems to be working as expected, it is still too early to speculate. I am hoping to publish the results once I have been able to run it for a substantial amount of time.
Thank you very much for reading! Let me know if you have any questions or comments.
Post a Comment